
The objective
Beamm.brussels is a highly data-driven platform. Thus, the first step consists of building a micro-dataset that contains all the necessary information for running the micro-simulation model, as well as all the socio-economic information needed to conduct a detailed socio-economic impact assessment. Beamm uses a wide range of micro-data. This implies two important challenges. First, no existing representative Belgian or Brussels dataset covers nearly all the pieces of information that Beamm needs. Therefore, we combine information from different sources. Second, a part of this information is sensitive, and the privacy of Belgian citizens and data security must crucially be guaranteed. To tackle the first challenge, we develop machine learning algorithms to merge different existing datasets, each containing parts of the required information, into one single synthetic dataset. These algorithms combine administrative data with a variety of survey data containing information on the socio-economic background of households, as well as their expenditure, mobility habits, capital holdings, etc. Concretely, we combine the administrative data with survey data, such as the Survey on Income and Living Conditions (EU-SILC), the Household Finance and Consumption Survey (HFCS), the Household Budget Survey (HBS), the Labour Force Survey (LFS), Beldam, Monitor, the Time Use Survey (HETUS), etc.
Statistical matching
It is crucial to understand that the process of merging these datasets through statistical matching does not aim to accurately reconstruct personal information at the level of individual citizens or households. All the individuals and households observed in our datasets remain anonymous, preventing us from accurately connecting disparate pieces of information at the individual level. Furthermore, our objective does not necessitate or require the reconstruction of this information for individual citizens or households. Our focus lies in understanding the impact of a reform at the societal level. Hence, the inability to construct a synthetic dataset accurate at the individual level does not hinder the creation of a dataset that is statistically accurate at the population level, effectively representing the real world as closely as possible.
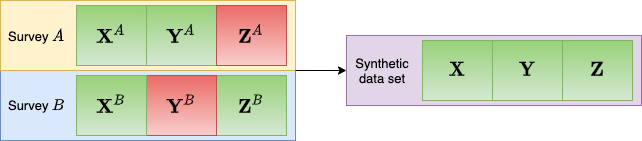
Figure 1: Schematic representation statistical matching. We train a neural network on how specific information that we have (Y^A and Z^B) to the common variables X to fill in the gaps, marked in red. D’Orazio et al. (2006)
To achieve this, we utilize machine-learning algorithms that facilitate the merging of data present in various datasets, each containing information about different individuals, based on shared informative content (see Figure 1). The individuals generated within the final synthetic database are thus ‘chimeras,’ synthesized through the amalgamation of information observed for multiple distinct individuals from diverse databases sharing common characteristics. As a result, the merged database is consistently inaccurate at the individual level since these synthesized individuals do not exist. However, it maintains statistical accuracy at the population level (see, for instance, Rässler (2002) or D’Orazio et al. (2006)).
Generating fictitious datasets
After this first exercise of statistical matching, we have a realistic and rich dataset, with individuals and households that are a recombination of pieces of information from different original observations. However, these recombined individuals can still contain chunks of actual information. To avoid the use of any real data in the online Beamm platform, we develop generative AI algorithms to create a 100% fictitious dataset that has the same joint distributions as the ‘real’ synthetic dataset. More precisely, we use Generative Adversarial Networks (GAN), a technique introduced by Goodfellow et al (2014) that is typically used to create fake images and videos. GAN has two neural networks competing in a series of successive rounds: a ‘generator network’ draws fictitious data from noise, while a ‘discriminator network’ trained on the real data determines the nature (real or fake) of each line in the generated fictitious dataset and sends this information back to the generator. The two networks compete in a series of back-and-forth rounds until the fictitious data look very much like the real data. After this production of a realistic fictitious dataset, the latter is validated and controlled to prevent accidental similarities with any observation in the real data. The resulting synthetic fictitious but highly realistic dataset is then used for our online applications (see, e.g., Cheng et al (2020) or Wang et al (2017) for a literature review or an introduction to GAN).
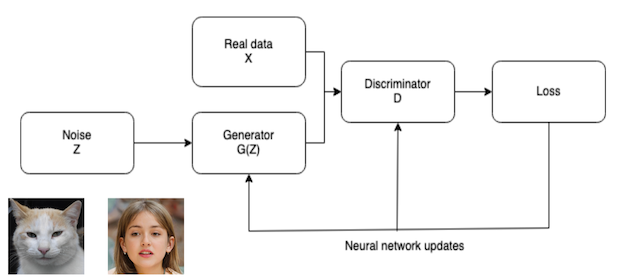
Figure 2: Schematic representation of GAN. The cat and girl famously don’t exist in real life, but were generated using GAN. (Picture of the girl coming from thispersondoesnotexist.com and the one of the cat from thiscatdoesnotexist.com)